2. 贵州省山地珍稀动物与经济昆虫重点实验室, 贵阳 550005
2. Guizhou Provincial Key Laboratory for Rare Animal and Economic Insect of the Mountainous Region, Guiyang 550005, China
Ficus tikoua, also known as ‘di-gua’ or ‘di-pipa’ in China, is a woody plant in Ficus genus (Moraceae), and has been widely planted in south China, India, Vietnam, and Laos. It has historically been used in traditional folk medicine due to its wide range of biological and medicinal properties, including cyto- toxic[1], antioxidant[2] and anti-inflammatory[3] acti- vities. The secondary metabolites of F. tikoua have also attracted considerable attention. A new benzofuran glucoside, exhibiting moderate antioxidant activities, and a new antifungal pyranoisoflavone were isolated from the stems of F. tikoua[4-5]. Previous studies have focused on its chemical constituents and distribution. Wei et al.[5] have isolated and identified seven known compounds from the stem of F. tikoua. Yan et al.[6] have detected 152 kinds of volatile substances from frozen F. tikoua, including esters (33.06%), alcohols (13.14%), alkanes (13.18%), ketones, aldehydes and acids. A study on the genetic diversity of the dwarf F. tikoua in China revealed moderate diversity within populations and a significant isolation-by-distance pattern among populations[7]. Liu et al.[8] reported morphological and physiological plasticity in F. tikoua, which could adapt to karst habitats and be suitable for use in vegetation restoration. Wang et al.[9] reported that F. tikoua has a great potential for antimony (Sb) phytoremediation, which otherwise binds to non- dissolved or low bioavailable compounds. However, there were few studies reported on the molecular mechanisms of genomics in F. tikoua.
RNA-Seq is extensively used to identify new genes and gene families, explore SNPs and molecular markers, uncover evolutionary mechanisms, describe transcriptional profiles, confirm metabolic pathways, etc. Owing to its high throughput, high reproducibility, wide detection range and accurate quantitative traits, RNA-Seq technique has been widely used in agriculture, biology, medicine and other fields. Many studies have also assessed the transcriptomes of human[10], yeast[11], mice[12] and maize[13]. There were more and more researches on the transcriptome of non-model plants, such as rose[14], safflower[15] and tobacco[16].
The transcriptome of three F. tikoua cultivars were detected in this study, which would compre- hensively understand the complex mechanism of gene expression and regulation in different tissues (i.e. blade and stem) at the transcriptional level, and analyze the genetic differentiation of three F. tikoua cultivars from different regions in China. These would broaden our scope on the genetic information of F. tikouacultivar, which may be applied to improve its cultivation and breeding.
1 Materials and methods 1.1 Plant materialsThree F. tikoua cultivars were collected in China from Enshi City of Hubei Province, Liupanshui and Guiyang City in Guizhou Province, and labeled as No. 1, No. 2 and No. 3, respectively. There were signi- ficant differences in morphological features (i.e. leaf and stem) among them (Table 1). The F. tikoua cultivars were planted in the same field in Nanchong City, Sichuan Province, China. Blades (labelled as Y) and stems (labelled as J) at seedling stage were collected for extract total RNA. According to the variety and tissue type, six samples were marked as Y1, Y2, Y3, J1, J2, and J3, respectively, three biological replications per sample.
| Table 1 Morphology of three cultivars of Ficus tikoua from China |
Total RNA was extracted from the samples by using a Trizol kit (TaKaRa, Dalian, China). Beads with oligo (dT) were used to isolate poly (A) mRNA. Fragmentation buffer was added to digest mRNA into short fragments. Taking these short fragments as templates, the first-strand cDNA was synthesized using a random hexamer primer. The second-strand cDNA was obtained by using buffer, dNTPs, RNase H and DNA polymerase I. Samples were purified using a QiaQuick PCR extraction kit (TaKaRa, Dalian, China) and resolved with EB buffer for end reparation and to add poly (A). These short fragments were then connected to sequencing adaptors. Suitable fragments were selected as templates for amplification with PCR. Lastly, the library was sequenced using the Illumina HiSeqTM 2500 platform.
Before bioinformatics analysis, quality control and filtering of raw data are required in order to confirm the quality of data used and to decrease data noise, respect- tively. Low-quality reads, adaptor sequences and reads with an excess of N were removed using an in-house Perl script. We filtered out reads that had more than 10% of bases with a sequencing quality lower than a value of 10. Only filtered, clean reads were used for subsequent analysis.
1.3 de novo Assembly and functional annotationAll clean reads from six samples were mixed and assembled using Trinity (http://trinityrnaseq.source forge.net/). The assembled, clean data were then aligned to transcripts using Bowtie2 with default settings (http://bowtie-bio.sourceforge.net/Bowtie2/ index.shtml). RSEM (http://deweylab.biostat.wisc.edu/ RSEM) was used to assess the degree of gene expression of assembled transcripts. To annotate and classify the function of genes, all the contigs from assembly of the RNAseq data were aligned to the NR (non-redundant protein sequences in NCBI, ftp://ftp.ncbi.nlm.nih.gov/blast/db ), Swiss-Prot (http://ftp.ebi. ac.uk/pub/databases/swissprot), Trembl (http://www. ebi.ac.uk/interpro), KEGG (Kyoto Encyclopedia of Genes and Genomes database, http://www.genome.jp/ kegg) and COG (clusters of orthologous groups, http://www.ncbi.nlm.nih.gov/COG) databases by BlastX (BLAST, basic local alignment search tool), and aligned to the Nt (nucleotide sequence, ftp://ftp.ncbi.nlm.nih.gov/blast/db ) database by BlastN (e values < 1e-5).
1.4 Gene expression analysisThe differential expression genes (DEGs) were analyzed among six samples. The threshold of log2 fold-change≥1 and the false discovery rate (FDR) < 0.05 from multiple tests were used to define the DEGs. A log2 fold-change≥1 indicated fold-change values of gene expression levels≥2.
Analysis of differential gene expression was conducted to assess the expression levels of genes that were significantly altered in the different samples or under different experimental conditions. ‘The absolute value of log2 Ratio≥1 and probability > 0.8’ were used as the threshold to judge the significance of gene expression difference.
1.5 CDS predicationIt is possible to discover CDS through compa-risons of assembled transcripts and gene annotations from the NR, Swiss-Prot, KEGG and COG databases. Tool ESTScan (http://www.ch.embnet.org/software/ ESTScan2.html) was used to predict the potential protein-coding sequence.
1.6 SSR and SNP analysisIn the present study, a single-nucleotide polymer- phism (SNP), or mutation, was defined as an RNA sequence variation that occurred when a single nucleo- tide (A, T, C or G) differed among samples. BWA tool was used to align the reads of each sample to the transcript. The SNPs from each sample were identified using GATK[17] (http://bio-bwa.sourceforge.net). Simple sequence repeats (SSRs), also known as microsatellite DNA, are segments of DNA comprised of 1–6 nucleo- tides that are repeated several times in the genome. The MicroSAtellite identification tool[18] was used to detect the SSR sequences in the transcripts.
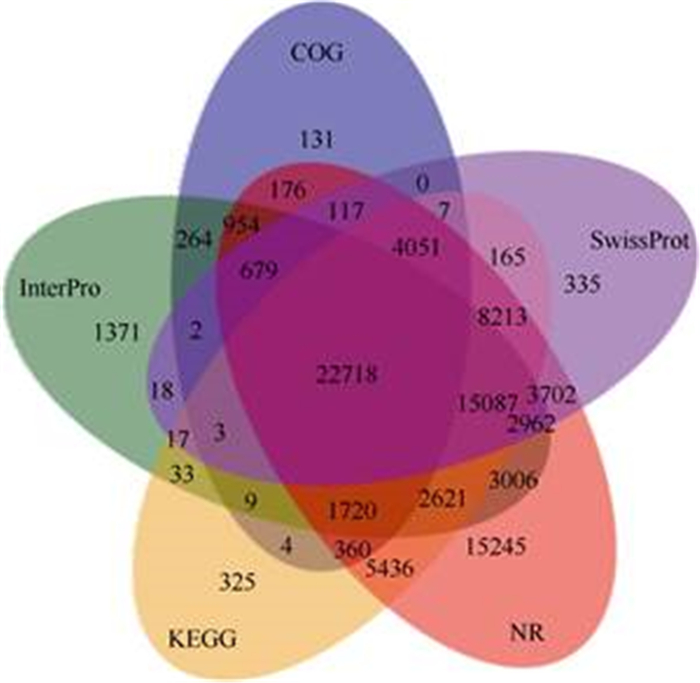
2 Results 2.1 RNA sequencing and de novo assemblyTotal RNA was extracted from the leaves and stems of three cultivars at seedling stage to compre- hensively determine the F. tikoua transcriptome. After removing the adaptor sequences, reads with excessive N proportion and low-quality reads though RNA-Seq, a total of 309 512 672 reads with lengths of 150 bp, including 2 063 418 nucleotide sequences, were obtained from six samples (Y1, Y2, Y3, J1, J2 and J3). All reads were deposited in the National Center for Biotechnology Information (NCBI) and can be down- loaded from the Short Read Archive (SRA) Sequence Database by using the accession number (SRP131999). These RNA-seq data were combined and assembled by using Trinity with default settings, except for the K-mer value (25), to construct unique consensus sequences, which produced 154 756 336 contigs with an N50 of 955 bp. The mean percent of GC was 48.76%. A total of 197 362 transcripts were generated after all contigs was reassembled and the redundancy was reduced by TGICL (Table 2). The total and average lengths of the transcripts were 114 072 125 and 577 bp, respectively. The detailed distribution of transcript lengths are shown in Fig. 1. The transcripts with lengths < 500 bp, 500–1 000 bp, 1 000–2 000 bp and > 2 000 bp accounted for 74.46%, 11.34%, 9.49% and 4.71%, respectively. The longest transcript (5 098 bp) found in this study was TR82916|c0_g1_i1, which encodes an auxin transport protein based on Swiss- Prot annotation.
|
Fig. 1 Length distribution of Ficus tikoua transcripts |
| Table 2 Assembly information of transcripts from three cultivars of Ficus tikoua |
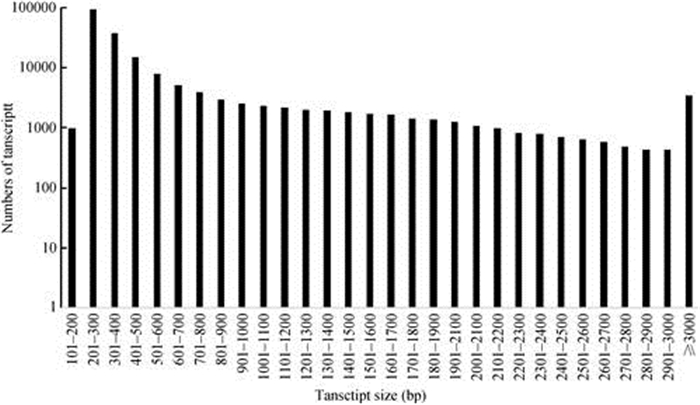
To perform functional annotation on the trans- cripts, all the assembled transcripts were aligned to eight databases by BlastX and BlastN with e-values < 1e-5, including NR, Swiss-Prot, KEGG, COG, GO, NT, PFAM, and Interpro. A total of 87 047, 58 076, 460 769, 128 421 and 51 464 transcripts were detected in the NR, Swiss-Prot, KEGG, NT and Interpro datalogous sequences in these databases and about 30% of the transcripts were not identified (Fig. 2).
|
Fig. 2 Venn diagram of functional annotation aligned to NR, COG, KEGG, Swissprot and Interpro |
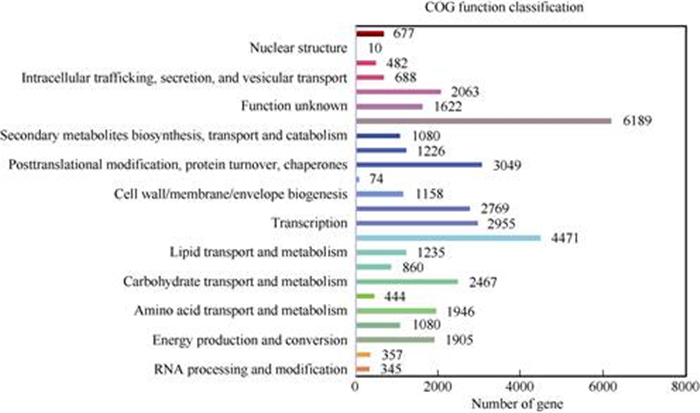
All transcripts were aligned against COG data- base to check the integrity of our transcriptome bases, respectively, which transcripts assigned to multiples. A total of 22 718 transcripts possessed homo-library and to assess the effectiveness of the annotation process. A total of 31 195 in 197 366 transcripts (accounting for 15.81%) were identified in COG database, which were then grouped into 24 functional categories according to their possible functions (Fig. 3). The COG function classification showed that the largest category was ‘general function prediction’ with 6 189 transcripts (3.14%), followed successively by the ‘translation, ribosomal structure, and biogenesis’ (4 471, 2.27%), ‘posttranslational modification, protein turnover, chaperones’ (3 049, 9.1%), transcription (2 995, 8.30%), ‘replication, recombination and repair’ (2 769, 6.90%) and ‘function unknown’ (1 622, 3.50%) classifications. Only a few transcripts were grouped into the categories ‘nuclear structure’ (10) and ‘cell motility’ (74).
|
Fig. 3 COG classification of the transcripts derived from Ficus tikoua |
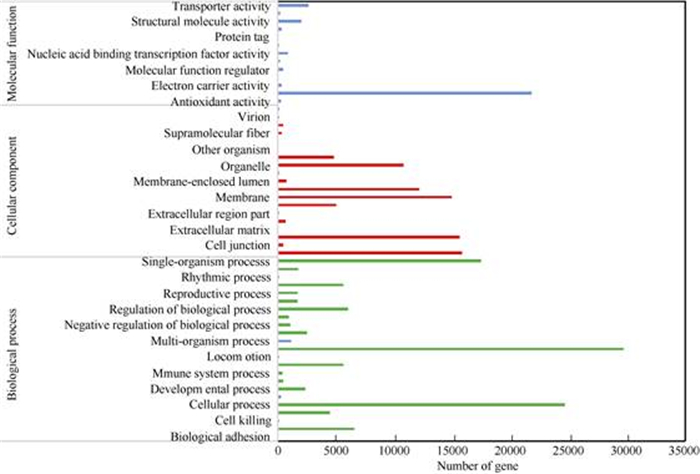
In total, 248 137 transcripts were aligned with the GO database, which were classified into 169 cate- gories. As shown in Fig. 4, most transcripts were categorized to function in the ‘biological process’, then by ‘cellular process’ and ‘molecular function’. There were 114 356 transcripts grouped in the ‘biolo- gical process’, which were annotated with 23 classes. The largest proportion of transcripts categorized in the ‘biological process’ (29 674), which were involved in the ‘metabolic process’. Cellular components contained 81 825 transcripts, which were annotated with 22 classes. The transcripts within the ‘cellular component’ classi- fication were mostly assigned to the ‘cell’ (15 795), ‘cell part’ (15 593) ‘membrane’ (14 957), ‘membrane part’ (12 151) and ‘organelle’ (10 762). The molecular function category contained 51 956 transcripts, among which most, i.e. 23 035 and 21 776 transcripts, were related to ‘catalytic activity’ and ‘binding’, respectively.
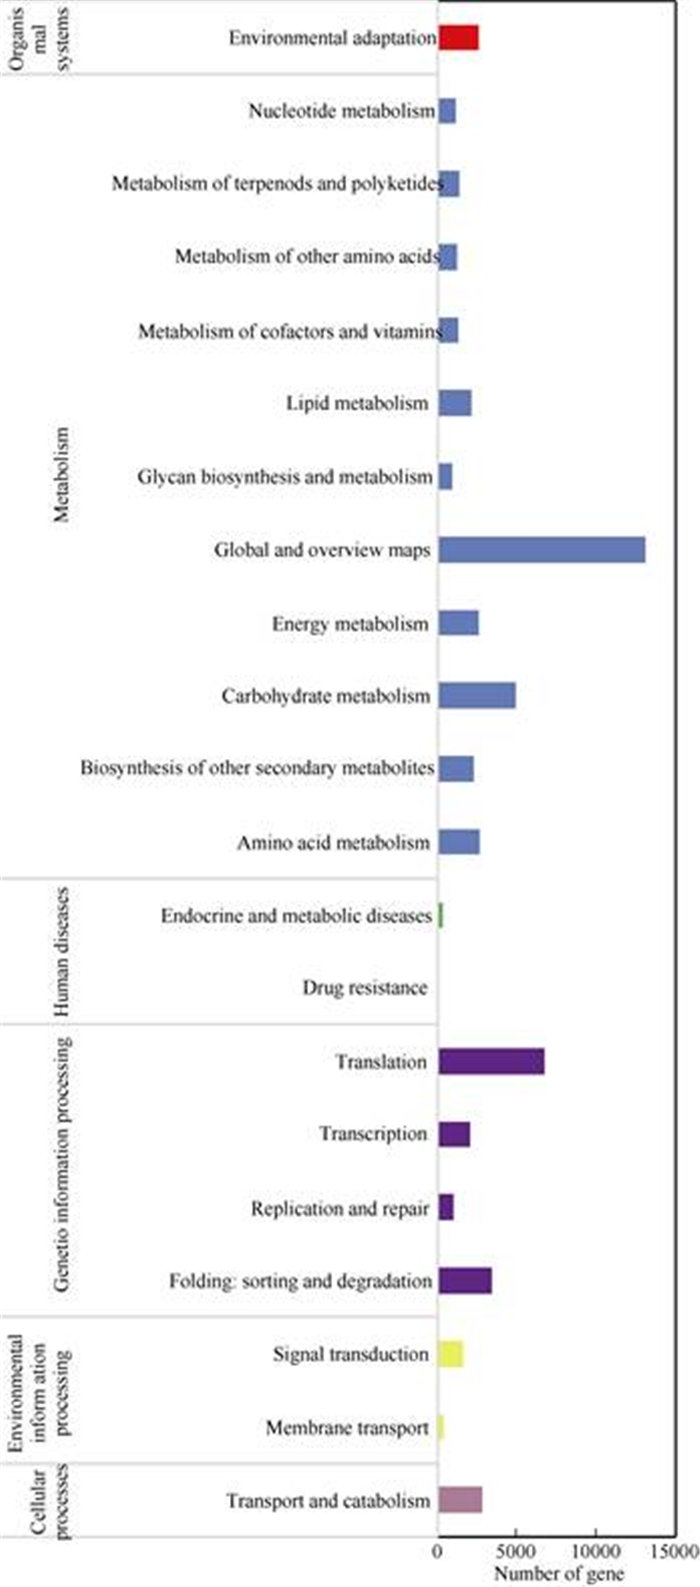
The total assembled transcripts were aligned to the KEGG database to determine the function of gene products in the cellular processes, metabolism and the organismal system (Fig. 5). We investigated 73 516 transcripts (accounting for 37.35%) belonging to 150 KEGG pathways, among which 33 711 transcripts were involved in metabolic pathways. The majority of these transcripts were involved in global and overview maps (13 145) and carbohydrate metabolism (4 929). A total of 13 218 transcripts were related to the processing of genetic information, of which 6 780 transcripts were involved in translation. A small number of these trans- cripts were related to transport (2 838) and catabolism and environmental adaptation (2 556).
|
Fig. 4 GO classification of the transcripts derived from Ficus tikoua |
A total of 88 353 coding sequences (CDSs) were obtained, of which the total length and GC-content was 42 310 239 bp and 46.95%, respectively. According to functional annotation, these CDSs were predicted by BlastX (81 386 CDSs) and ESTScan (6 967 CDSs). The mean length of CDSs and the N50 were predicted to be 496 bp and 756 bp by BlastX, 272 bp and 255 bp by ESTScan, respectively.
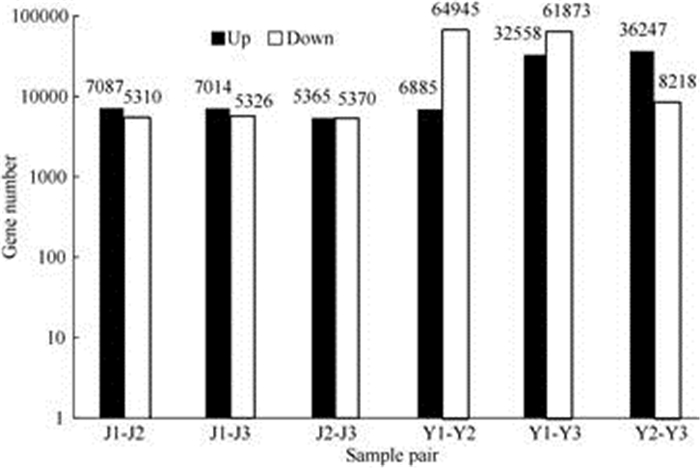
2.4 Analysis of differential gene expressionThe DEGs were obtained through pairwise comparison among three cultivars. Six sample-pairs, i.e. J1 vs. J2, J1 vs. J3, J2 vs. J3, Y1 vs. Y2, Y1 vs. Y3, Y2 vs. Y3 were chosen. The identified DEGs in the six sample-pairwise were as follows: 12 397 (J1 vs. J2), 12 340 (J1 vs. J3), 10 373 (J2 vs. J3), 94 431 (Y1 vs. Y2), 71 830 (Y1 vs. Y3), 44 465 (Y2 vs. Y3) (Fig. 6). Regardless of the type of plant tissue (leaf or stem), the differences between No. 1 vs. No. 2 and No. 1 vs. No. 3 were much higher than that in the No. 2 vs. No. 3. Furthermore, the number of DEGs in the leaf (Y) was much higher than that in the stem (J).
Compared with J2, J1 had more up-regulated DEGs (7 087) than down-regulated DEGs. Similarly, the up-regulated DEGs accounted for a higher propor- tion in J1 vs. J3. Moreover, the number of up-regulated DEGs was nearly the same as the down-regulated DEGs in J2 vs. J3. In contrast, more down-regulated DEGs were detected in Y1 vs. Y2 and Y1 vs. Y3. There were 64 945 down-regulated DEGs in Y1 and only 6 885 up-regulated DEGs in Y2, nearly ten times. However, the up-regulated DEGs occupied higher proportion of DEGs in Y2 vs. Y3. In summary, it was suggested that among the three cultivars, the differences in DEGs in leaf were significantly greater than those in stem.
2.5 GO enrichment analysis of DEGsOnly 3 399 DEGs in J1 vs. J2 were genes with a known function. As a result of GO enrichment analysis, DEGs in J1 vs. J2 were classified into 17 cellular component categories annotated with 206 terms (1 022 DEGs, 30.07%), 11 molecular function categories annotated with 381 terms (1 033 DEGs, 30.39%), and 19 biological process categories anno-tated with 1 221 terms (1 244 DEGs, 36.60%).
|
Fig. 5 KEGG classification of the transcripts derived from Ficus tikoua |
The results of GO enrichment in J1 vs. J3, J2 vs. J3, Y1 vs. Y2, Y1 vs. Y2, and Y2 vs. Y3 indicated thatthe GO classification of DEGs in these six pairs are almost unanimous. Specifically, the top three largest categories in the biological process were‘metabolic process’, ‘cellular process’, and ‘single-organism process’. In the cellular component group, most DEGs were enriched in the ‘cell’, ‘cell part’, ‘membrane’, and ‘membrane part’. In the molecular function group, DEGs were mainly enriched in ‘catalytic activity’ and ‘binding’. Interestingly, some transcripts were only expressed in the J1, J2, J3, Y1, Y2 or Y3 samples, which indicated that the expression of these DEGs from F. tikoua are apparently tissue-specific and variety-specific.
|
Fig. 6 Statistics of differentially expressed genes |
To identify the physiological mechanisms of DEGs in leaf and stem in F. tikoua, 126, 129, 125, 134, 138 and 137 metabolic pathways were obtained from DEGs in six pairs: J1 vs. J2, J1 vs. J3, J2 vs. J3, Y1 vs. Y2, Y1 vs. Y2 and Y2 vs. Y3, respectively, through pathway enrichment analysis. Most DEGs were involved in ‘metabolic pathways’, ‘biosynthesis of secondary metabolites’, and ‘ribosomes’. The top three enriched pathways in each pair are shown in Table 3, wherein the higher the enrichment factor, the more significant the enrichment. The J1 vs. J2 and J1 vs. J3 pairs shared the ‘cutin, suberin, and wax biosynthesis’ and ‘anthocyanin biosynthesis’ pathways. Among the six sample-pairs, the top-three enriched pathways were mainly related with secondary metabolism.
| Table 3 Top-three enriched pathways of differential expression genes (DEGs) in stem (J) and leaf (Y) of three cultivars of F. tikoua |
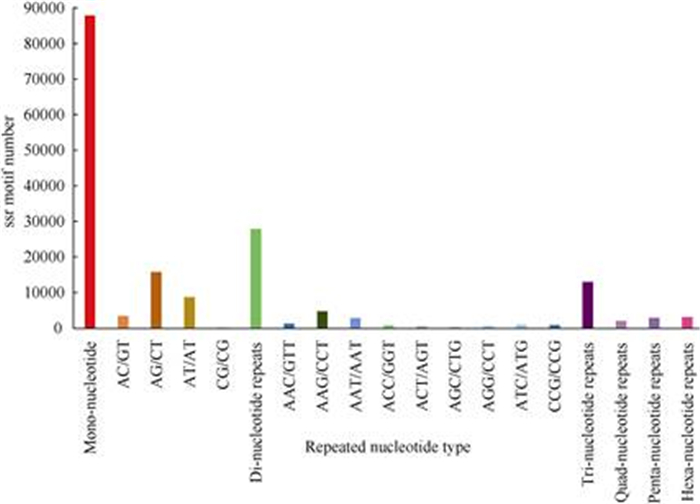
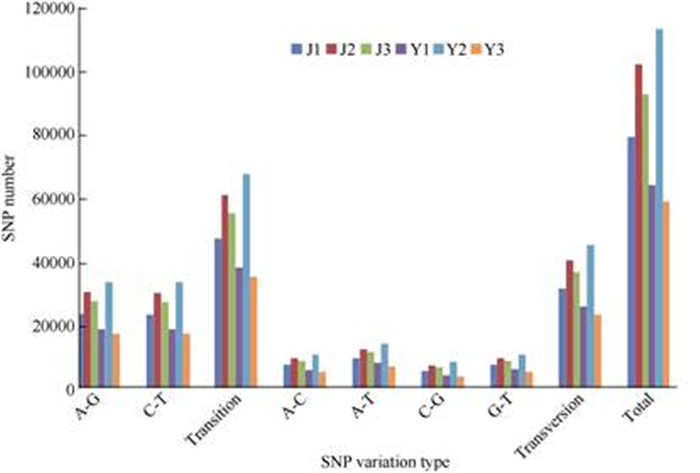
SNP and SSR markers are widely used in genetic mapping. In this study, 177 329 SSR motifs and 20 repeated nucleotide types were obtained by using MISA, which were involved in 120 857 transcripts (Fig. 7). It was found that the number of mono- nucleotide repeats (87 901) were much higher than that of other kinds of repeats. There were only 30 SSR motifs that belonged to CG/GC types. The SSR length was 12–36 bp. Six SNP variation types were found in the six cDNA library, including A-G, C-T, transition, A-C, A-T, G-C and transversion (Fig. 8), which had a higher number of transitions than that of other types.Regardless of the tissue type (leaf or stem), the number of each SNP type detected in the No. 2 cultivar (J2, Y2) was higher than that of the other cultivars (No. 1 and No. 3). Total number of SNPs in Y2 was the highest among six samples, while Y3 had the lowest.
|
Fig. 7 SSR length distribution of Ficus tikoua transcripts |
|
Fig. 8 SNP detected from Ficus tikoua transcriptomics library |
We conducted the transcriptome analysis of Ficus tikoua in China by using the Illumina HiSeq 2500 platform. Ther were 309 512 672 clean reads and 197 362 assembled unigenes obtained, which may serve as the base of a large-scale function prediction. Compared with datasets published on tissue-specific transcriptomes from other fig cultivars, the number of unigenes obtained from F. tikoua was higher than that obtained from female flowers of Ficus hirta (53 445)[19], gynodioecious fig (Ficus carica) fruits (71 455)[20], and ripening parthenocarpic and pollinated fig fruits (147 051)[21]. The average length of the transcripts assembled in this study was 577 bp, which was longer than that from other fig cultivars. However, the N50 length of transcripts obtained in F. tikoua was shorter than that of other fig cultivars.
The average length of unigenes obtained in this study was 597 bp, which was longer than that from fig fruit (F. carica) (459 bp) but shorter than that from Codonopsis pilosula (728 bp)[22], and another medicinal plant. The portion of transcripts longer than 500 bp was found to represent more than 25% of all assembled transcripts, and 78.94% of the transcripts was mapped, implying a higher quality of the cDNA library and reliability of Illumina HiSeq 2500 technology for functional gene screening in Chinese F. tikoua[23].
In the present work, 139 992 transcripts were annotated by using several bioinformatics tools, accounting for 70.93% of the total transcripts. The annotation rate was much higher than in pollinated and parthenocarpic fig fruit[21]. The annotation rate also differed among the eight databases used in the present study. A total of 21 590 domains and 3 780 active sites were predicted through the alignment of the unigenes to the PFAM database, which laid the foundation for discovering the gene functions. How- ever, about 30% of the transcripts were not identified in this study, possibly due to the lack of reference genomes and annotation information of some data- bases.
DEGs were detected from the six sample pairs in the present work, including 12 397 DEGs between J1 vs. J2, 12 340 DEGs between J1 vs. J3, 10 373 DEGs between J2 vs. J3, 94 431 DEGs between Y1 vs. Y2, 71 830 DEGs between Y1 vs. Y3, and 44 465 DEGs between Y2 vs. Y3. These DEGs were classified into the ‘cellular component’, ‘molecular function’, and ‘biological process’ categories. Most DEGs were involved in the ‘metabolic process’, ‘cellular process’, ‘single-organism process’, ‘cell part’, ‘membrane’, ‘membrane part’ ‘catalytic activity’, and ‘binding’, which was consistent with the annotation of the transcripts from the databases. These results suggested that there were genetic differences in the different F. tikoua cultivars, as indicated by the functional genes in leaf and stem. Chen et al.[7] reported that there was moderate genetic diversity among six F. tikoua populations (FST 0.196, P < 0.001), which was higher than that of other dioecious figs. Because the growth form may determine the differences in gene flow between fig species, those DEGs found in leaf and stem suggested tissue-specific genetic characteristics of the different F. tikoua cultivars. Due to limitation in the function classification system in the GO data, many DEGs also require a supplementary analysis using other approaches. A similar phenomenon has been found in other plants[24-25].
KEGG analysis showed that most DEGs were involved in ‘metabolic pathways’, ‘biosynthesis of secondary metabolites’, and ‘ribosomes’, which indicated that the differences in metabolic processes between these three cultivars were significant. More- over, the number of DEGs in leaf was much higher than in stem among all three cultivars. This also implied that leaf was more involved in ‘metabolic pathways’, ‘biosynthesis of secondary metabolites’, and ‘ribosomes’ than stem. Plants often use secondary metabolic products to defend against biotic and abiotic stressors, which may be useful for long-term survival. Secondary plant metabolites are also used in other pathways, such as signal transduction, regulating metabolic activity within cells and regulating the growth and development of plants. Plants must have a high level of secondary metabolic activity to maintain an intricate balance with environmental condition[26]. DEGs between leaf and stem were significantly enriched in the biosynthesis of secondary metabolites, indicating that leaf and stem, as nutrient organs, display an important role in resist invasion of abiotic stress. However, the secondary metabolites exhibited tissue specificity, whereby biosynthesis was regulated by gene expression.
Some SNP and SSR markers, and novel transcripts were also found in this study, which will undoubtedly benefit further genetical identification of morphological characteristics and the discovery of new genes in F.tikoua. Wu et al.[27] demonstrated that EST-SSR markers in sponge gourd by RNA-seq were beneficial to discover novel genes and screen marker. Therefore, more work is needed to confirm these findings.
This is the study to characterize the transcrip- tional profiles in Chinese F. tikoua. The obtained distinguished information on functional genes has important applications for further cloning and analyses of the full-length sequence of these transcripts.
| [1] |
JIANG Z Y, LI S Y, LI W J, et al. Phenolic glycosides from Ficus tikoua and their cytotoxic activities[J]. Carbohydr Res, 2013, 382: 19-24. DOI:10.1016/j.carres.2013.09.008 |
| [2] |
DONFACK J H, SIMO C C F, NGAMENI B, et al. Antihepatotoxic and antioxidant activities of methanol extract and isolated compounds from Ficus chlamydocarpa[J]. Nat Prod Commun, 2010, 5(10): 1607-1612. |
| [3] |
CHEN L W, CHENG M J, PENG C F, et al. Secondary metabolites and antimycobacterial activities from the roots of Ficus nervosa[J]. Chem Biodivers, 2010, 7(7): 1814-1821. DOI:10.1002/cbdv.200900227 |
| [4] |
WEI S P, LUAN J Y, LU L N, et al. A new benzofuran glucoside from Ficus tikoua Bur[J]. Int J Mol Sci, 2011, 12(8): 4946-4952. DOI:10.3390/ijms12084946 |
| [5] |
WEI S P, WU W J, JI Z Q. New antifungal pyranoisoflavone from Ficus tikoua Bur[J]. Int J Mol Sci, 2012, 13(6): 7375-7382. DOI:10.3390/ijms13067375 |
| [6] |
YAN X Q, LIAO B, YAN X F, et al. SPME-GC-MS Analysis of volatile components in fruits of the frozen Ficus tikoua Bur[J]. Food Res Dev, 2016, 37(22): 139-143. (in Chinese). DOI:10.3969/j.issn.1005-6521.2016.22.032 |
| [7] |
CHEN Y, JIANG Z X, COMPTON S G, et al. Genetic diversity and differentiation of the extremely dwarf Ficus tikoua in Southwestern China[J]. Biochem Syst Ecol, 2011, 39(4/5/6): 441-448. DOI:10.1016/j.bse.2011.06.006 |
| [8] |
LIU C C, LIU Y G, GUO K, et al. Exploitation of patchy soil water resources by the clonal vine Ficus tikoua in karst habitats of south-western China[J]. Acta Physiol Plant, 2011, 33(1): 93-102. DOI:10.1007/s11738-010-0520-z |
| [9] |
WANG Y, CHAI L Y, YANG Z H, et al. Subcellular distribution and chemical forms of antimony in Ficus tikoua[J]. Int J Phytorem, 2017, 19(2): 97-103. DOI:10.1080/15226514.2016.1189398 |
| [10] |
PAN Q, SHAI O, LEE L J, et al. Deep surveying of alternative splicing complexity in the human transcriptome by high-throughput sequencing[J]. Nat Genet, 2008, 40(12): 1413-1415. DOI:10.1038/ng.259 |
| [11] |
NAGALAKSHMI U, WANG Z, WAERN K, et al. The transcriptional landscape of the yeast genome defined by RNA sequencing[J]. Science, 2008, 320(5881): 1344-1349. DOI:10.1126/science.1158441 |
| [12] |
MORTAZAVI A, WILLIAMS B A, MCCUE K, et al. Mapping and quantifying mammalian transcriptomes by RNA-Seq[J]. Nature, 2008, 5(7): 621-628. DOI:10.1038/nmeth.1226 |
| [13] |
TEOH K T, REQUESENS D V, DEVAIAH S P, et al. Transcriptome analysis of embryo maturation in maize[J]. BMC Plant Biol, 2013, 13(1): 19. DOI:10.1186/1471-2229-13-19 |
| [14] |
KIM J, PARK J H, LIM C J, et al. Small RNA and transcriptome deep sequencing proffers insight into floral gene regulation in Rosa cultivars[J]. BMC Genom, 2012, 13(1): 657. DOI:10.1186/1471-2164-13-657 |
| [15] |
HUANG J L, YANG P, LI B L. Study on activity of several enzymes of cytoplasmic male-sterile cotton line Jin A[J]. Cotton Sci, 2004, 16(4): 229-232. (in Chinese). DOI:10.3969/j.issn.1002-7807.2004.04.007 |
| [16] |
HAFIDH S, BREZNENOVÁ K, RŮŽIČKA P, et al. Comprehensive analysis of tobacco pollen transcriptome unveils common pathways in polar cell expansion and underlying heterochronic shift during sperma-togenesis[J]. BMC Plant Biol, 2012, 12: 24. DOI:10.1186/1471-2229-12-24 |
| [17] |
LI H. Aligning sequence reads, clone sequences and assembly contigs with BWA-MEM[J]. arXiv: 1303.3997, 2013.
|
| [18] |
ISELI C, JONGENEEL C V, BUCHER P. ESTScan: A program for detecting, evaluating, and reconstructing potential coding regions in EST sequences[C]//Proceedings International Conference on Intel-ligent Systems for Molecular Biology; ISMB. International Conference on Intelligent Systems for Molecular Biology, 1999: 138-148. doi: 10.0000/PMID10786296.
|
| [19] |
YU H, NASON J D, ZHANG L, et al. De novo transcriptome sequencing in Ficus hirta Vahl. (Moraceae) to investigate gene regu-lation involved in the biosynthesis of pollinator attracting volatiles[J]. Tree Genet Genom, 2015, 11(5): 91. DOI:10.1007/s11295-015-0916-4 |
| [20] |
IKEGAMI H, HABU T, MORI K, et al. De novo sequencing and comparative analysis of expressed sequence tags from gynodio-ecious fig (Ficus carica L.) fruits:Caprifig and common fig[J]. Tree Genet Genomes, 2013, 9(4): 1075-1088. DOI:10.1007/s11295-013-0622-z |
| [21] |
ROSIANSKI Y, DORON-FAIGENBOIM A, FREIMAN Z E, et al. Tissue-specific transcriptome and hormonal regulation of pollinated and parthenocarpic fig (Ficus carica L.) fruit suggest that fruit ripening is coordinated by the reproductive part of the syconium[J]. Front Plant Sci, 2016, 7: 1696. DOI:10.3389/fpls.2016.01696 |
| [22] |
GAO J P, WANG D, CAO L Y, et al. Transcriptome sequencing of Codonopsis pilosula and identification of candidate genes involved in polysaccharide biosynthesis[J]. PLoS One, 2015, 10(2): e0117342. DOI:10.1371/journal.pone.0117342 |
| [23] |
DONG B, WU B, HONG W H, et al. Transcriptome analysis of the tea oil camellia (Camellia oleifera) reveals candidate drought stress genes[J]. PLoS One, 2017, 12(7): e0181835. DOI:10.1371/journal.pone.0181835 |
| [24] |
HE M, WANG Y, HUA W P, et al. De novo sequencing of Hypericum perforatum transcriptome to identify potential genes involved in the biosynthesis of active metabolites[J]. PLoS One, 2012, 7(7): e42081. DOI:10.1371/journal.pone.0042081 |
| [25] |
LAI Z X, LIN Y L. Analysis of the global transcriptome of longan (Dimocarpus longan Lour.) embryogenic callus using Illumina paired-end sequencing[J]. BMC Genomics, 2013, 14(1): 561. DOI:10.1186/1471-2164-14-561 |
| [26] |
VERPOORTE R. Secondary metabolism[M]//VERPOORTE R, ALFERMANN A W. Metabolic Engineering of Plant Secondary Metabolism. Dordrecht, Netherlands: Kluwer Academic Publishers, 2000.
|
| [27] |
WU H B, GONG H, LIU P, et al. Large-scale development of EST-SSR markers in sponge gourd via transcriptome sequencing[J]. Mol Breed, 2014, 34(4): 1903-1915. DOI:10.1007/s11032-014-0148-6 |
 2020, Vol. 28


